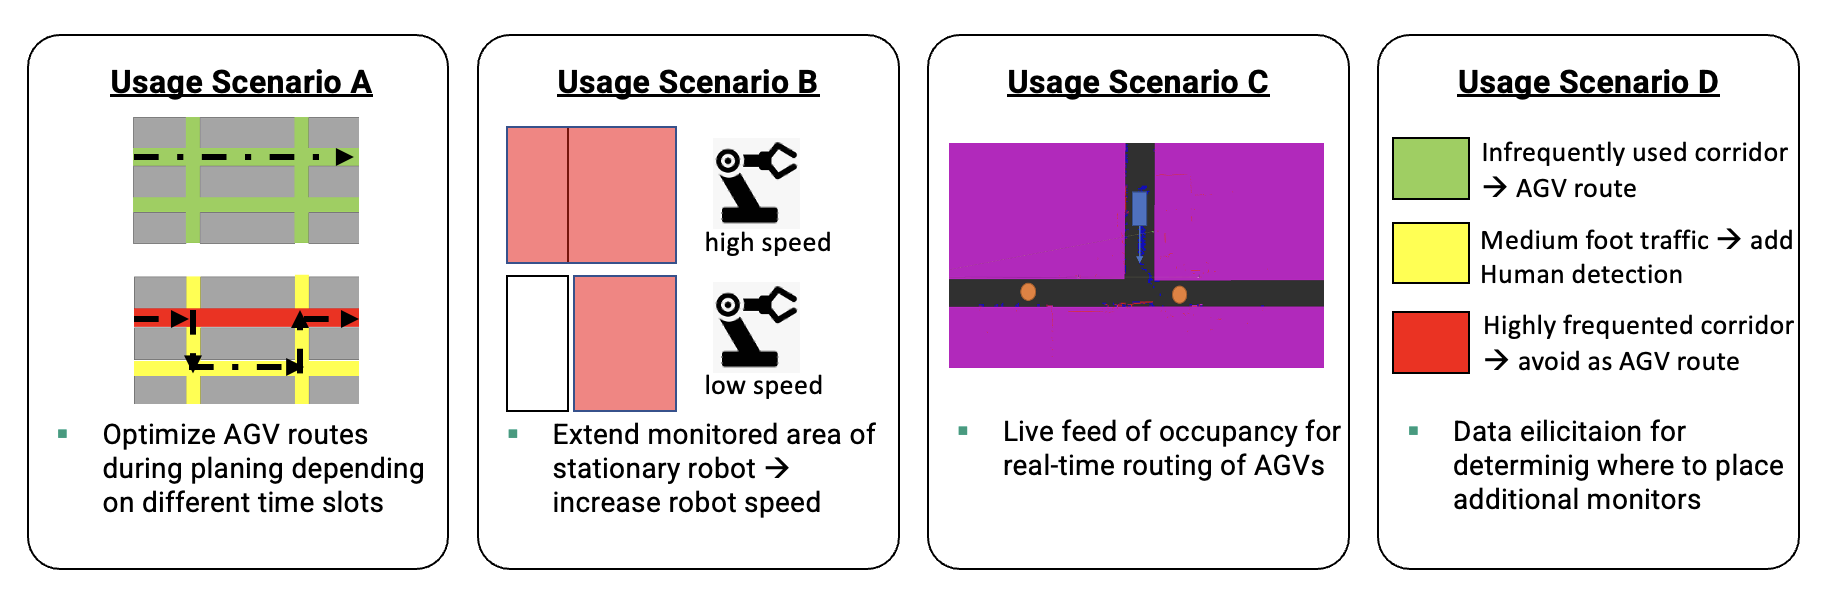
The solution maps human traffic inside a factory and uses this data to propose interventions on the factory floor to optimize logistics or asset placements.
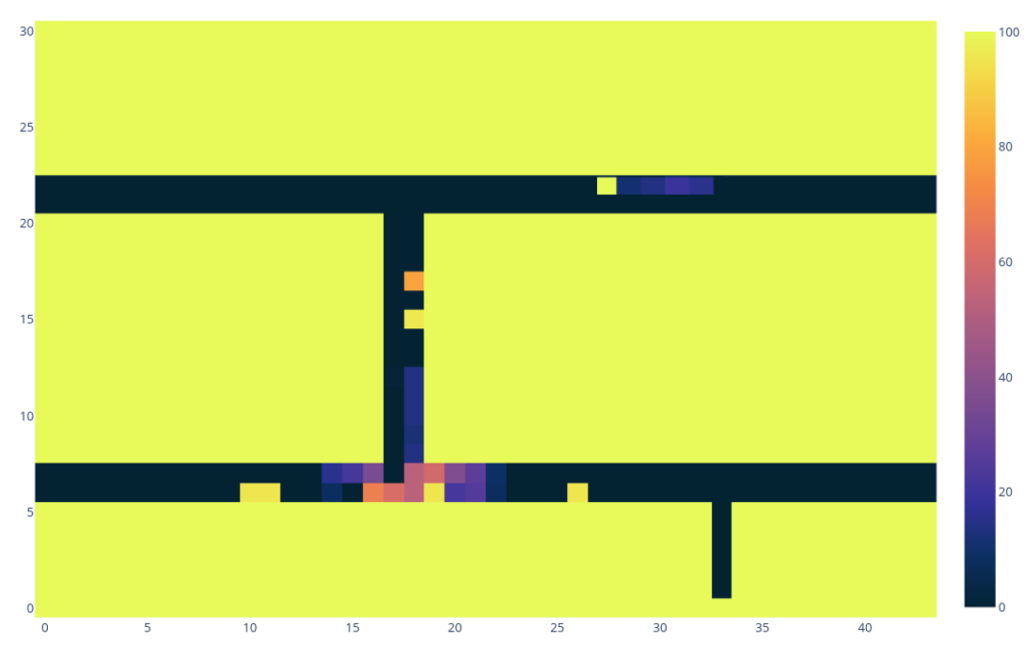
A set of laser scanners installed in the factory create heat maps with 1m2 resolutions. These heat maps are used for real time monitoring as well as to develop longer term insights into human movement around the factory.
What problem does it solve?
What is needed to use it?
It can avoid logistical delays by anticipating to actual situations on the floor. It can also extend the monitoring area of robots to increase the robot speed.
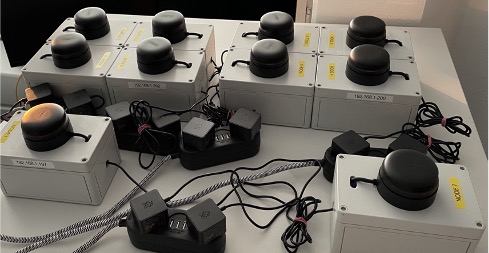
Laser scanners + internet connection + a pc + a minimum of 1 AGV or robot in operation.
KPI's / Numbers
Who is using it?
Increase speed of robots working in a factory by xx%. *Pending after KTEs experimentation
The solution has not been used so far in Better Factory experiments
Images
Training Content
Temporal Heatmap of Human Occupancy
The objective of the package is to create the temporal heatmaps that show for each square meter, and each one hour of each workday, the rate of human occupancy.