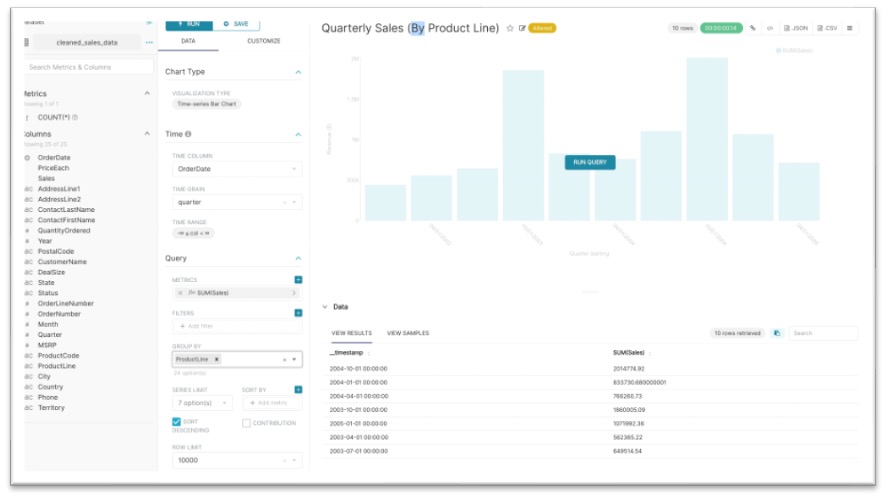
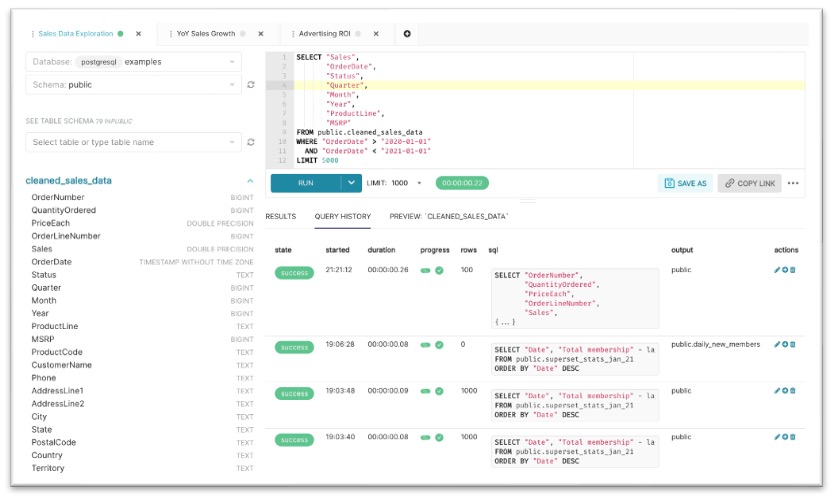
The solution is a visualisation dashboard which allows for monitoring of factory data such as resource consumption, sensor input data or machine data, providing real time insight as well as historical review.
Any data available in the factory can be fed to the dashboard after data collection, storage and connection to the database.
What problem does it solve?
What is needed to use it?
It provides insight into a number of relevant processes occurring in the factory, giving relevant knowledge to management.
A computer, internet connection and data collection infrastructure of choice.
KPI's / Numbers
Who is using it?
Allows for xx factory processes to be monitored through one dashboard. *Pending after KTEs experimentation
This website uses cookies to improve your experience while you navigate through the website. Out of these, the cookies that are categorized as necessary are stored on your browser as they are essential for the working of basic functionalities of the website. We also use third-party cookies that help us analyze and understand how you use this website. These cookies will be stored in your browser only with your consent. You also have the option to opt-out of these cookies. But opting out of some of these cookies may affect your browsing experience.
Necessary cookies are absolutely essential for the website to function properly. This category only includes cookies that ensures basic functionalities and security features of the website. These cookies do not store any personal information.
Any cookies that may not be particularly necessary for the website to function and is used specifically to collect user personal data via analytics, ads, other embedded contents are termed as non-necessary cookies. It is mandatory to procure user consent prior to running these cookies on your website.